Visualization Projects
Visualization Projects siteadminScientific Visualization - My current work focus is on developing techniques and tools for visually conveying the information, often leading to better understanding of data/concept/phenomemon to scientists and people in general. All Projects on one page
GlyphSea: An application to visualize vector fields
GlyphSea: An application to visualize vector fields siteadmin|
GlyphSea: An application to visualize vector fields Programming: Emmett Mcquinn, UCSD/SDSC Seismology Advisor: Bernard Minster, SIO/UCSD Technical Advisor: Jurgen Schulze, CalIT2/UCSD Tools: C++, OpenScenceGraph, CG and GLSL Shaders, QT |
How does one display vector field? How would one visualize a time evolution of ground motion for an earthquake? Vector visualization is an important area to investigate scientific data in many domains. Prior visualization strategies have primarily focused on low resolution and discrete glyph plots or volumetric rendering of scalar fields, which do not permit a full characterization of underlying phenomena. We have developed an interactive glyph visualization application that allows scientists to explore vector fields. We implement a novel technique of procedural dipole texturing to encode and display vector data which shows magnitude and direction. We employ a novel lattice method to show neighborhood, which also enables to distinguish glyphs. We further enhance visualization by using screen space ambient occlusion, jitter, outline halos and displacement. By combining contextual information with glyphs, such as geographic maps and representations of crustal structure with three-dimensional isosurfaces, scientists are able examine vector fields in a rich and interactive multivariate environment. We demonstrate the results for time-dependent vector data from a three different simulations including the "Big One" earthquake simulation affecting the Los Angeles region. These new visualizations clearly depict the obvious features as well those missed in previous investigation. GlyphSea was featured at SIGGRAPH 2010: Live Real Time Demos, SciDAC 2010 and TeraGrid 2010 (Best Visualization Nominee). GlyphSea won Honorable Mention at International Science & Engineering Visualization Challenge 2010 in non-interactive category. |
2008 - 2011 View Demo News Article |

M8 Quake
M8 Quake siteadmin
M8 Earthquake Simulation_320.jpg) Viz Credits: Amit Chourasia Data Credits: Kim Olsen, Yifeng Cui, Kwangyoon Lee, Jun Zhou, Geoffrey Ely, P Small, D Roten, Steve Day, Phil Maechling, Tom Jordan, D K Panda, J Levesque Tools: TEEM, Vista, Maya |
Magnitude 8.0 wall-to-wall scenario on the San Andreas fault from Bombay Beach to Parkfield.
Publication - Y. Cui, K. Olsen, T. Jordan, K. Lee, J. Zhou, P. Small, G. Ely, D. Roten, D. K. Panda, A. Chourasia , J. Levesque, S. Day and P. Maechling (2010). "Scalable Earthquake Simulation on Petascale Supercomputers", In Proceedings of the 2010 ACM/IEEE International Conference for High Performance Computing, Networking, Storage and Analysis (SC '10). IEEE Computer Society, Washington, DC, USA, 1-20. People's Choice OASCR award at SciDAC 2011. |
Apr - Dec 2010 |
, In Proceedings of the 2010 ACM/IEEE International Conference for High Performance Computing, Networking, Storage and Analysis (SC
ShakeOut Earthquake simulations
ShakeOut Earthquake simulations siteadmin Shakeout Earthquake Simualtions Visualization Credits: Amit Chourasia, SDSC Data Credits:Kim Olsen et. al and Southern California Earthquake Center Tools: Vista, TEEM, Maya |
Very large earthquake simulations on a domain of 6000x3000x800 mesh points. "The Big One" movie awarded for Outstanding Achievement in Scientific Visualization at the 2009 SciDAC conference. The movie was also be featured at SIGGRAPH 2009 Computer Animation Festival. Publication: K. B. Olsen, S. M. Day, L. Dalguer, J. Mayhew, Y. Cui, J. Zhu, V.M. Cruz-Atienza, D. Roten, P. Maechling, T.H. Jordan, and A. Chourasia (2009), ShakeOut-D: Ground Motion Estimates Using an Ensemble of Large Earthquakes on the Southern San Andreas Fault With Spontaneous Rupture Propagation, Geophysical Research Letters, 36, L04303 |
2007-2008 More info Movie: The Big One |
Columbia River Flow in Washington
Columbia River Flow in Washington siteadmin|
Columbia River Flow visualization
 Viz Credits: Amit Chourasia Data Credits: David Pierce et. al. SIO,LLNL Tools: Maya and PDC-Utils |
Scientists at SIO and LLNL are simulating water resource on a global scale. This visualization is based on a part of data from one such simulation done by Tim Barnett's group. The visualization shows the flow of Columbia River from 1980-1999 along with snow in the context. We Maya for creating visualization of this data. | July 2006 View Animations |
First 3-D Image of Antibody Gene
First 3-D Image of Antibody Gene siteadmin First 3-D Image of Antibody Gene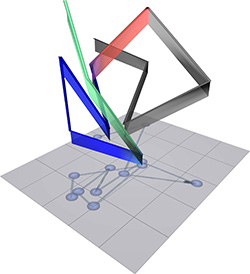 Visualization Credits: Amit Chourasia, Steve Cutchin Data Credits: Suchit Jhunjhunwala and Cornelis Murre, UCSD Tools: Maya, Python |
UC San Diego researchers have shown for the first time how a genome - the most essential part of the cell for storing and accessing genetic information - is organized in three-dimensional space. This 3D rendering is an immunoglobulin locus in B cells, showing the relative positions of various portions of immunoglobulin genes. The grey band indicates constant regions; blue defines proximal variable regions; and green are distal variable regions. The red band indicates the linker connecting the proximal variable and joining regions. | Apr 2008 More info |
TeraShake 1 & 2 Earthquake Simulations
TeraShake 1 & 2 Earthquake Simulations siteadmin TeraShake 1 & 2 Viz Credits: Amit Chourasia, Steve Cutchin Data Credits: Kim Olsen el. al. SCEC Tools: Maya, Vista Volume Renderer |
TeraShake 1 & 2 models earth shaking that could rattle Simulations Southern California if a 230 kilometer section of the San Andreas fault ruptured producing a magnitude 7.7 earthquake. The simulation consists of 7 different simulations, 4 in phase one and 3 in phase two yielding a total of 160 TB of data. We have done visualization of portions of this data with a variety of methods for scientific investigation and dissemination. There are over 130,000 images and more than 50 unique movies created in this project.
Publication - Chourasia, A., Cutchin, S. M., Olsen, K.B., Minster, B., Day, S., Cui, Y., Maechling, P., Moore, R., Jordan, T. (2007) Highlights |
2004-2006 |
TeraShake 2.3
|
 This images shows how the computation was divided among 240 processors in relation to the region. Each yellowish and greenish box represents a processor computing the volume bounded by it. |
May 2006 Movie (4 mb) |
TeraShake 2.2 |
Feb 2006 Movie (3 mb) |
|
TeraShake 2.1 |
Nov 2005 | |
TeraShake 1.4 |
Jun 2005 Movie (22 mb) |
|
TeraShake 1.3 |
Feb 2005 Movie (30 mb) Movie (11 mb) |
|
TeraShake 1.2 |
Nov 2004 Movie (30 mb) |
|
TeraShake 1.1 |
Sep 2004 Movie (235 mb) Project Webpage |
1906 San Francisco Earthquake
1906 San Francisco Earthquake siteadmin Visualization of 1906 San Francisco Earthquake Simulation (Maya, PDC-Utils, C++) Viz Credits: Amit Chourasia, Steve Cutchin, Mike Rossmasler Viz Credits: Amit Chourasia, Steve Cutchin, Mike Rossmasler Data Credits: Brad Aagaard et. al. USGS |
To better understand the distribution of shaking and damage Earthquake caused by the great earthquake of 1906, seismologists have constructed new computer models to recreate the earthquake ground motions. The USGS simulations show how the ground moved on each side of the San Andreas fault and how seismic waves radiated away from the fault to produce the shaking. The earthquake, which began two miles offshore of San Francisco, caused shaking and damage along more than 300 miles of the San Andreas Fault. Yellow to red colors indicate regions that experienced damaging shaking.
Amit was approached to create a 3d visualization from the simulated data. The data consisted of a irregular mesh of 36,000 vertices with 65,000 faces and information about velocity and displacement at each vertex. We implemented the visualization pipeline using Maya. Publication: A. Chourasia, S. M. Cutchin, B. Aagaard (2008), "Visualizing the ground motions of the 1906 San Francisco earthquake", Computers & Geosciences, Elsevier (in press.) |
March 2006 Project Webpage |
CFD - Turbulence Simulation
CFD - Turbulence Simulation siteadminTurbulence Visualization  Viz Credits: Amit Chourasia Data Credits: P K Yeung, Diego Donzis Tools: Vista Volume Renderer |
Turbulent flows, which are very challenging to predict, include such important practical problems as how well different chemical species will mix and possibly react in a fluid. This 3D volume rendering shows the solar dissipation rate for a weakly diffusive passive contaminant computed on SDSC's Datastar supercomputer on a 2048^3 grid. The very high resolution of these direct numerical simulations in an SDSC SAC collaboration with NSF-supported research by P.K. Yeung and his group at Georgia Tech reveals the complex sheet-like topology of high activity regions where the most intense turbulent mixing and chemical reactions occur. |
Apr 2006 More Info |
PDC Utils
PDC Utils siteadmin| PDC-Utils (C/C++) Credits: Amit Chourasia, Peter J Lu, John Moreland |
This utility can read the contents of pdc files created by maya. It can also create them using external data. This is specially helpful if you need to create particle system or deform a mesh using scientific data. |
Feb 2006 More Info |
Seven Story Building Shake
Seven Story Building Shake siteadmin
Digital Recreation of a Seven Story Building Shake during an Earthquake Viz Credits: Amit Chourasia, Steve Cutchin, Mike Rossmasler Data Credits: Jose Restrepo, Marios Panagiotou, Ruben Soto-Alcauter, Andrew Collier Tools: C++, Maya, PDC-Utils |
UC San Diego's Jacobs School of Engineering shook a full-size 275-ton building erected on a shake table, duplicating ground motions recorded during the January 17, 1994 Northridge earthquake in Los Angeles, California. To record the impact on the building, the structure was fitted with about 600 sensors and filmed as the shake table simulated the earthquake, yielding a flood of data including stress, strain, and acceleration. By recreating the shake table experiment in a virtual environment based on the observed data, this lets engineers explore all the way from viewing the 'big picture'? of the entire building from a 360-degree viewpoint.
Publication - Chourasia. A. Digital Recreation of a Seven Story Building Shake during an Earthquake. ACM Crossroads, 13-3, 2007 View Article |
Nov 2006 View Animations |
Data Centric Transfer Functions
Data Centric Transfer Functions siteadmin Data Centric Transfer Functions for High Dynamic Range Volume Data Credits: Amit Chourasia, Jurgen Schulze Tools: C++ |
Creating effective transfer functions for high dynamic range scalar volume data is a challenging task. For data sets with limited information about their content, deriving transfer functions using mathematical properties (gradient, curvature, etc.) is a difficult trial and error process. Using traditional method, the transfer functions are typically stored in integer look-up tables, which do not work well when the data range is large. We developed a process of opacity guidance with simple user interface that can be used as the basis for transfer function design. Our technique which uses opacity weighted histogram equalization lets users derive transfer functions for HDR floating point easily and quickly. We also showed how to adopt these techniques for real-time interactive visualization with minimal pre-processing.
Publication - Chourasia. A., Schulze. J. "Data Centric Transfer Functions for High Dynamic Range Volume Data". In Proceedings of the International Conference on Visualization and Computer Vision (WSCG) , Plzen, Czech Republic, January 29-February 01, 2007, pp. 9-16. |
Oct 2006 Download PDF |
Seismic Viz Portal
Seismic Viz Portal siteadmin| Seismic Vis Portal (Java, Javascript, Perl, Python, Teem, Image Magik)  Credits: Amit Chourasia, Alex Decastro, Steve Cutchin, Natlie Rubin, Lucas Gilbert |
Earthquake simulations produce vast amount of data. Much of the analysis is tied to what happens on the ground surface. To facilitate this investigation a rich geo-context is a must. Unfortunately, large amount of archived data from simulation is not seamlessly available to scientists. Virtual globes are becoming increasingly rich in contextual information and could be coupled with simulation data to provide this environment to scientists. We demonstrate such a system which integrates over 10 TB of earthquake simulation data and creates a variety of visualization products that integrates with virtual globes. This application web portal provides an intuitive and easy to use interface for scientific investigation, collaboration and dissemination of data. | Aug 2005 |
Self Contouring Technique
Self Contouring Technique siteadmin| Self Contouring Technique (Maya, Vista, C++)   Viz Credits: Amit Chourasia |
Encoding same information in 2 ways to reveal more info(Redundancy encoding). One way through color and other way through bump mapping. The data is color mapped on the top left image. On the lower left image the same color scheme is used and in addition a grey scale(much wider range then color) image of the same data is used to do bump mapping.The results are startling as one can see subtle variations in color which go undetected when just color encoded. I developed this technique and then found out that someone has already written a paper on similar techniques a few years ago :( None the less its a useful technique | Sept 2005 More Images More Images More Images More Images |
Poly2Vista
Poly2Vista siteadminPoly2Vista MEL(Maya Embeded Language) Viz Credits:Amit Chourasia |
A utility created for writing out poly object info (vertex and normals) from Maya to a text file. The output file could be used with Vista (command line volume renderer) and Mesh Viewer (interactive volume renderer) for slicing of volumes in desirable manner. |
Aug 2005 More Info |
Cam2Vista
Cam2Vista siteadminCam2Vista MEL(Maya Embeded Language) Credits: Amit Chourasia |
MEL utility created for writing out cameras matrices from Maya to text files. These text file then could be used with Vista (command line volume renderer) and Mesh Viewer (interactive volume renderer) for custom camera movment and positioning. This tool can also be used for importing existing ascii camera files into Maya. | Feb 2005 More Info |
Evolution of Early Universe
Evolution of Early Universe siteadmin Visualization of Evolution of Early Universe  Viz Credits: Donna Cox, Robert Patterson, Alex Betts, Amit Chourasia, Steve Cutchin Data Credits: Mike Norman, Robert Harkness et. al. Tools: C++, MEL, Maya, Vista Volume Renderer |
A high-resolution, data-driven visualization showing the evolution of the universe created by a collaboration between the San Diego Supercomputer Center (SDSC) and the National Center for Supercomputing Applications (NCSA) The movie has 2000 snapshots. Each snapshot signifies the passage of 6.8 million years, to encompass the nearly 14 billion years from the Big Bang to the present. The 26 Terabytes of data for the movie was computed by using simulation codes from a team of astrophysicists, led by Mike Norman at the University of California, San Diego. The animation was shown at Siggraph 2005 Dome Show in Los Angeles. | May 2005 More Info |
Puente Hills Earthquake Simulation
Puente Hills Earthquake Simulation siteadmin| Visualization of Earthquake simulation at Puente Hills in LA (Maya, Vista)  Viz Credits: Amit Chourasia Viz Credits: Amit Chourasia Data Credits: Ned Field, Robert Graves et. al. SCEC |
Animation featured on National Geographic's documentary on earthquakes in Sept 2006. Snippets of this clip were featured on TVand Web news on 25th May 2005 (CNN, CBS, MSNBC, KTLA see video footage) | May 2005 Movie ( 27 mb) Watch at Youtube Project Webpage |
Nano
Nano siteadmin| Visualization of Nano Scale structures (Pymol)  Viz Credits: Amit Chourasia Data Credits: Sharon Glotzer el. al. |
Interactive Visualization of assembly of nano scale systems for research conducted by Sharon Glotzer's group at MSE. | July 2004 More Info |
Enzo - Early Universe
Enzo - Early Universe siteadmin| Visualization of Early universe simulation (Vista)  Viz Credits: Amit Chourasia Data Credits: Mike Norman, Brain O Shea, Robert Harkness et. al. |
Visualization of early universe simulation. Simulation(ENZO) is done by Michael Norman's group at UCSD. The simulation spans 14 bilion years of cosmos in 200 timesteps and dataset is about 800 GB. Vista (our volume rendering software) was used to do the renderings. | May 2004 Movie ( 6.4 mb) |
Antibaker
Antibaker siteadmin| AntiBaker MEL(Maya Embeded Language) Credit: Amit Chourasia |
AntiBaker is created to ease and automate workflow for repetitive tasks. Specifically to reuse/share work. AntiBaker saves the configured info to external files which can be passed to different artists and re-used.
Publication - Villani, A. Nicolleta., Chourasia, A.,Cory, A. Clark. (2004).Production interface for web-deliverable realistic interactive 3D facial animation. The 12-th International Conference in Central Europe on Computer Graphics, Visualization and Computer Vision 2004, Plzen, Czech Republic |
Jan 2005 More Info |
Facial Expression Editor MEL(Maya Embeded Language) For joint based characters A script to create facial expressions by transforming joints.
User Interface
|
 Select chin joint  Move chin downwards by using sliders  Controlling morphs through sliders  Controlling morphs through sliders |
Oct 2003 This script was written as a Voluntary effort to help this group Sign Language Mathematics by 3D Computer Animation Visit Website A generalized implementation for maya available here |

Live Event
Live Event siteadmin| Live Event (3dstudioMax, Autocad)  CS Building 3d Model Viz Credits: Voicu Popescu, Chun Jia, Amit Chourasia, Neil Meskauskis, Elicia Dadlow, Robert Wilkes |
The objective of this project was to create a CG model of building from architectural drawings and present a real person inside it by real time chroma keying. This was a live event people could walk around inside the blue room and they were projected inside the virtual building. Amit was invited to lead the modelling group and create the CG model for the building, the exterior and interior shell was modelled by me and texture mapping and interior decoration was done by 3 students. Project Features:
|
Oct 2003
Low Resolution Movie (5.4 mb ) High Resolution Movie (36 mb Quicktime) The clips are realtime screen capture. |
Master's Directed Project
Master's Directed Project siteadmin| MS Directed Project (AVS Developer Edition)  Credits: Amit Chourasia |
Implementation of questionnaire data in an interactive visual environment to enable enhanced decision making using visual data analysis. (AVS -Advanced Visual Systems 6.1 Developer edition) | Aug 2003 |
Purdue Engineering Mall: Virtual Visit
Purdue Engineering Mall: Virtual Visit siteadmin Purdue University - Engineering Mall: Virtual Visit (C++, OpenGL, GLUT)  . .  . . Credits: Amit Chourasia, Abhay Lodhi, Karthik Rajagopal Credits: Amit Chourasia, Abhay Lodhi, Karthik Rajagopal |
The aim of the project was to make realistic looking buildings. Simple geometric modeling and texture mapping.
Modeling - Programmed using opengl with polygons, beizer curves and beizer patches. Texturing - Editing snapshot shots of building in photoshop. |
April 2003 Download Executable (windows2000: 2 mb) Source code not available for download |
Sept. 11 tragedy at Pentagon
Sept. 11 tragedy at Pentagon siteadmin Scientific Visualization of Sept. 11 tragedy at Pentagon (3dstudio Max, 3dsMax script, Autocad)    Viz Credits: Voicu Popescu, Chris Hoffman Hendri Lim, Chun Jia, Amit Chourasia |
My role was to write 3dMax Script to import simulated data into 3dStudioMax. The data was huge list of nodes and their connectivity information and several files at different time steps. The script read the files automatically and created the animated geometry. 3Dstudio Max choked out with the amount of data and the issue was resolved using isosurface models of data. The building was modeled using Autocad and 3dStudio Max. | Aug 2002 Visit Reseach Website |
Marching Cube
Marching Cube siteadmin| Implementation of Marching Cubes Algorithm (C++, GLUT)      Credits: Amit Chourasia |
A volume of 2.5x2.5x2.5 was used to sample the charge density of Benzene located at the origin. The volume is subdivided into smaller cubes ranging from 4 to 64 in number. Then it is discretly sampled at cube vertices for required isovalue and then linear interpolation was made for exact point on the corresponding edge. There-after normal's were calculated at the points for determining the face orientation. C, Opengl and Glut was used to create and shade the isosurface. A basic interactivity was added to view the surface from various orientations. | April 2002 Download Executable (windows2000:163kb) Source code not available for download |
Curve Editor
Curve Editor siteadmin| Curve Editor (C++, GLUT)     Credits: Amit Chourasia |
A simple program using C and Glut to create Beizer, Hermite and Spline curves. The programs takes points as input interactively and creates different curves. | Feb 2002 Download Executable (windows2000:182 kb) Source code not available for download |